Climate Risk Assessment
This article gives a detailed explanation of the Climate Risk Assessment feature and the calculations behind the graphs. For information on how to create Risk graphs and managing amount of accessible Business Units, refer to this article.
The goal of the climate risk functionality within Carbon+Alt+Delete is to perform an initial climate risk assessment for companies. The functionality provides a quantitative indication of both transition risks and physical risks, at the level of Business Units.
A Business Unit can be defined flexibly: it can be the full company, or a specific site. A Business Unit is defined by a specific location (needed to assess physical risks) and a turnover (needed to assess transition risks). Two Business Units are included free of charge.
Note that we quantify the exposure to climate risks (e.g., exposure to flooding hazard). To quantify the impact of those risks on business operations, the vulnerability is also relevant (e.g., building protection against floodings). Within the scope of this functionality we only look at exposure, vulnerability is out of scope.
Scope of the functionality
The following transition climate risks are considered, and expressed as a % of the companies' revenue:
- Carbon prices: increase in costs due to higher carbon prices to be paid directly (for scope 1 emissions) or indirectly (for scope 2 and scope 3 emissions);
- Energy prices: increase in energy prices due to higher fossil fuel prices, to be paid for direct fuel consumption (in scope 1) and electricity consumption (in scope 2);
- GDP (policy cost): decrease in economic growth due to the cost of climate change policies, reflecting in reduced revenues.
The following physical climate risks are considered, and expressed in a risk score on a 0 to 1 scale:
- Inland flooding: flooding of rivers or inland watercourses that inundates surrounding land and assets;
- Coastal flooding: rising sea levels (and storm surge) lead to inundation or increased flood risk in coastal zones;
- Heat wave: extended periods of abnormally high temperatures that pose stress to people, infrastructure and systems;
- Cold stress: periods of unusually low temperatures which increase risk of cold-related impacts to infrastructure, plants, animals and operations;
- Drought: prolonged deficits in precipitation leading to water scarcity, vegetation stress and impacts on supply chains or operations;
- Extreme rainfall: very intense precipitation events (short‐duration heavy rainfall) which can trigger flooding, erosion or landslides;
- Severe storm: high-intensity storm systems (wind, rain, hail) that cause damage to infrastructure, windload issues and cascading risks;
- Wildfire: large uncontrolled fires in natural or semi‐natural landscapes which threaten assets, ecosystems and supply chains;
- Landslide: movement of soil, rock or debris downhill, often triggered by heavy rainfall or changes in land saturation or slope stability;
- Temperature changes: long-term shifts or variability in average air temperature (e.g., warming trends) affecting systems, operations and adaptation needs;
- Precipitation changes: long-term changes in rainfall/snowfall amount, timing or intensity that alter availability of water, flood risk or drought exposure.
The above risks are quantified for 3 time horizons and 3 climate scenarios. The following time horizons are considered:
- 2020-2030: today, based on actual data and near-term forecast;
- 2030-2040: short-term, based on forecasts for an average year in this time period;
- 2040-2050: mid-term, based on forecasts for an average year in this time period
The following climate scenarios are considered (see also figure below):
- Low emissions (<2°C): this scenario assumes net-zero emissions being achieved by 2050, in line with the Paris Agreement, through swift, global and coordinated climate policy. As such, global surface temperature increase can be limited to less than 2°C by 2100. Transition risks (policy, technology, behavioural change) in this scenario are high because of the strong ambition and rapid transformation required. Conversely, physical risks (e.g., impacts of climate change itself) are relatively lower compared to less ambitious scenarios. This scenario corresponds with the RCP1.9 and RCP2.6 pathways developed by the IPCC, and with the Net Zero Scenario developed by NGFS.
- Intermediate emissions (+3°Cs): this scenario represents a moderate-policy pathway where countries implement their current Nationally Determined Contributions (NDCs) under the Paris Agreement, without major strengthening of climate action after 2030. As such, global surface temperature will increase by around 3°C by 2100. Transition risks are moderate, with policies and technological shifts occuring unevenly, with delayed decarbonization in some sectors. Physical risks are still significant, such as more frequent extreme weather and gradual climate damage, though less severe than in high-emission cases. This scenario corresponds with the RCP3.4 and RCP4.5 pathways developed by the IPCC, and with the Nationally Determined Contributions (NDCs) Scenario developed by NGFS.
- High emissions (>4°C): this scenario represents a business-as-usual or high-emissions pathway, where existing current policies are not strengthened or expanded after 2030, leading to continued emissions growth. As such, global surface temperature will increase by 4 to 5°C by 2100. Transition risks are very low, due to the lack of major decarbonization measures. Physical risks on the contrary are very high, with severe climate impacts, including frequent extreme weather events, rising sea levels, widespread ecosystem disruption, and major economic damage.
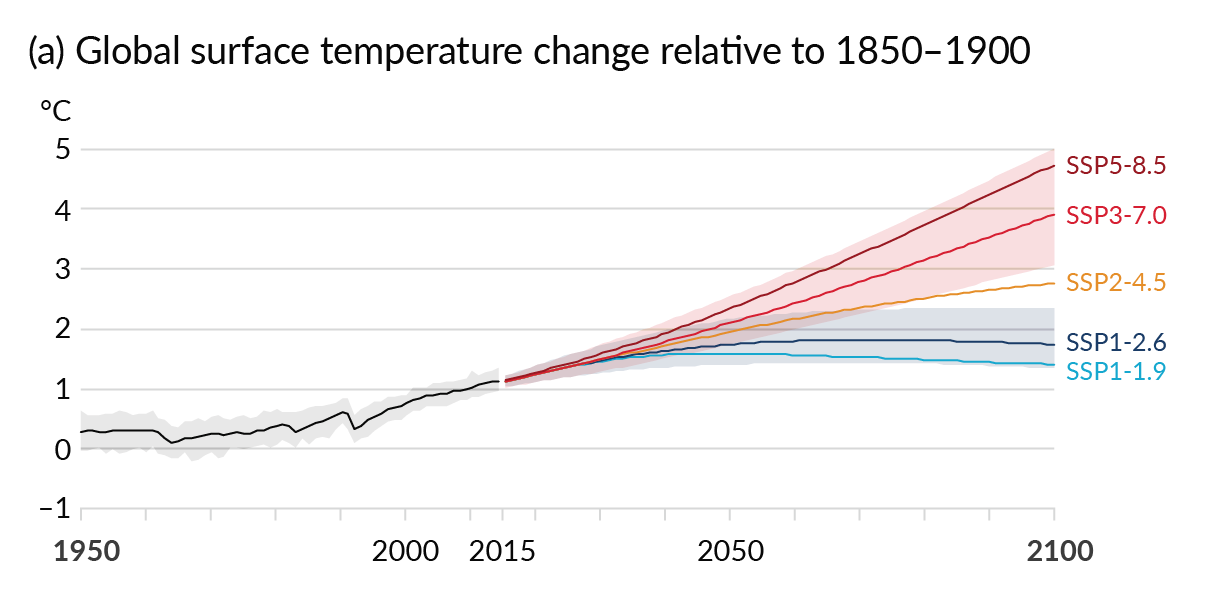
Source: IPCC 6th Assessment Report, Figure SPM.8
Data sources
The above is leveraging data from 2 main sources:
- For transitions risks: NGFS (Network of Central Banks and Supervisors for Greening the Financial System). We take data on future carbon prices, energy prices and GDP growth from NGFS. Source data can be found here: https://www.ngfs.net/ngfs-scenarios-portal/data-resources/.
- For physical risks: Weather Trade Net. We take data on future physical climate impacts from Weather Trade Net. This is proprietary data. More info can be found here: https://weathertrade.net/