Creating Risk Graphs
This article will explain how to set up your Climate Risk Assessment graphs. For a detailed explanation of the Climate Risk Assessment feature and the calculations behind the graphs, please refer to this article.
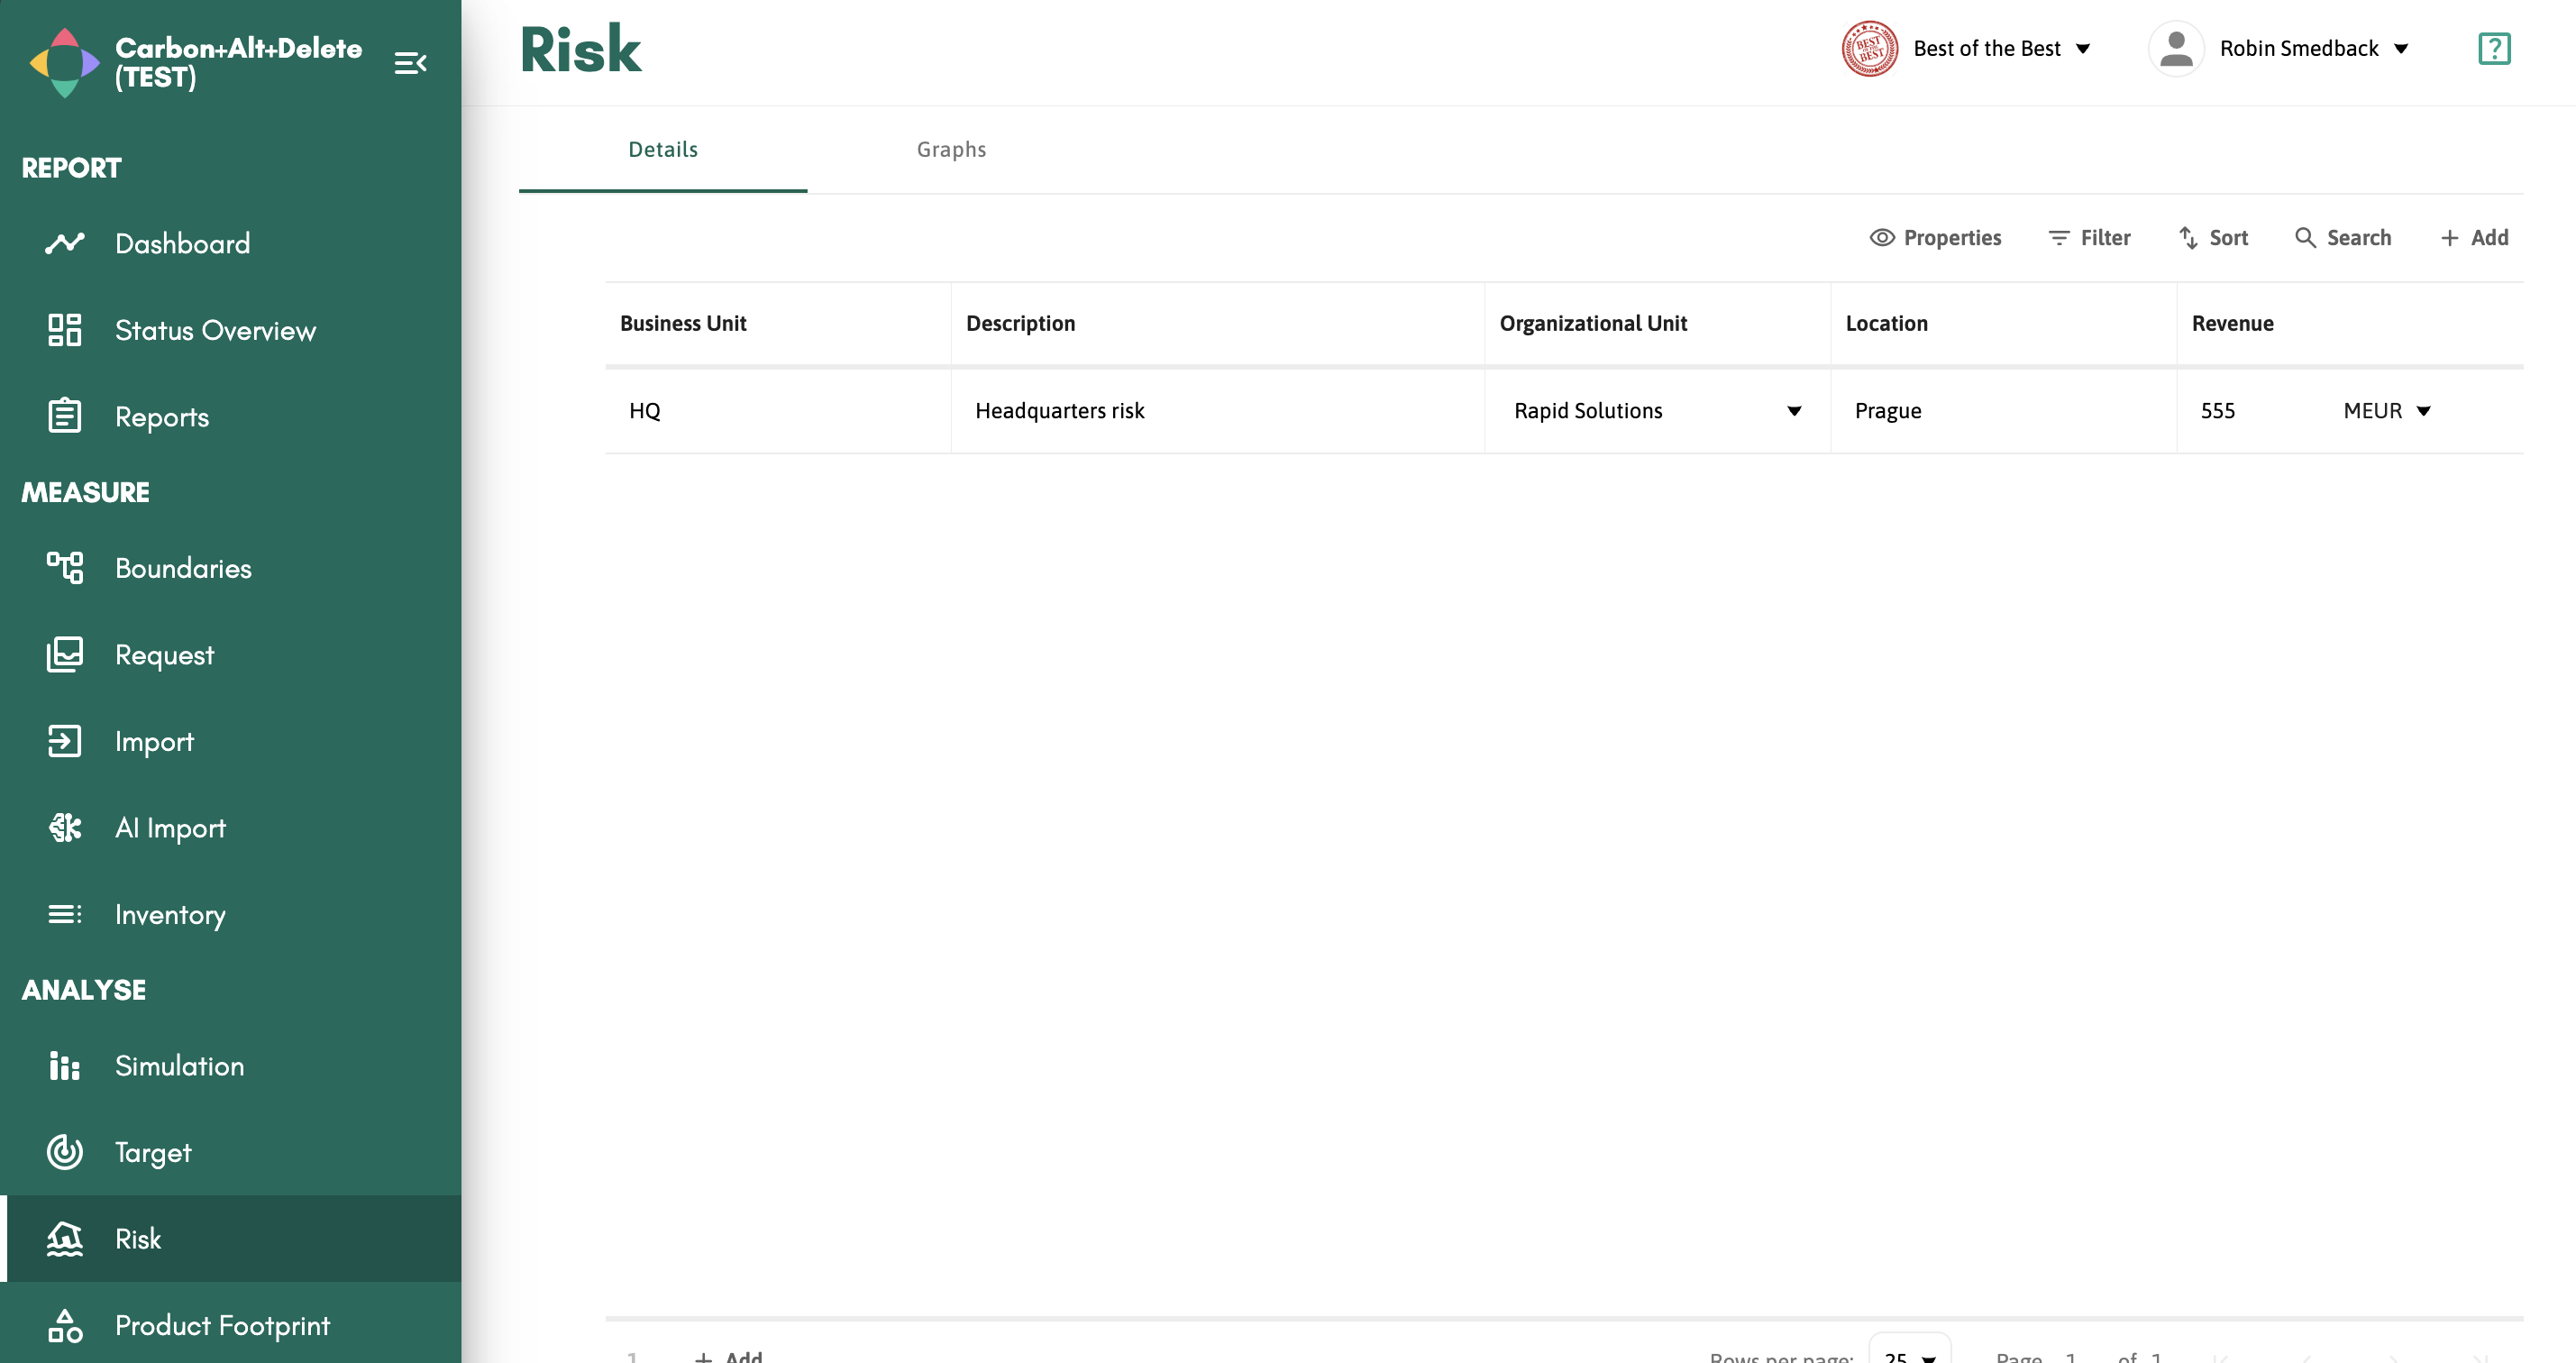
Creatinga Risk graph is a very straightforward process as there are only a few fields to fill out. Once you have clicked "+Add" on the Risk page, you need to input the following:
- Business Unit
- Description
- Organizational Unit
- Location
- Revenue
Once these are all filled out, you can navigate to the "Graphs" tab to review your Risk Assessment.
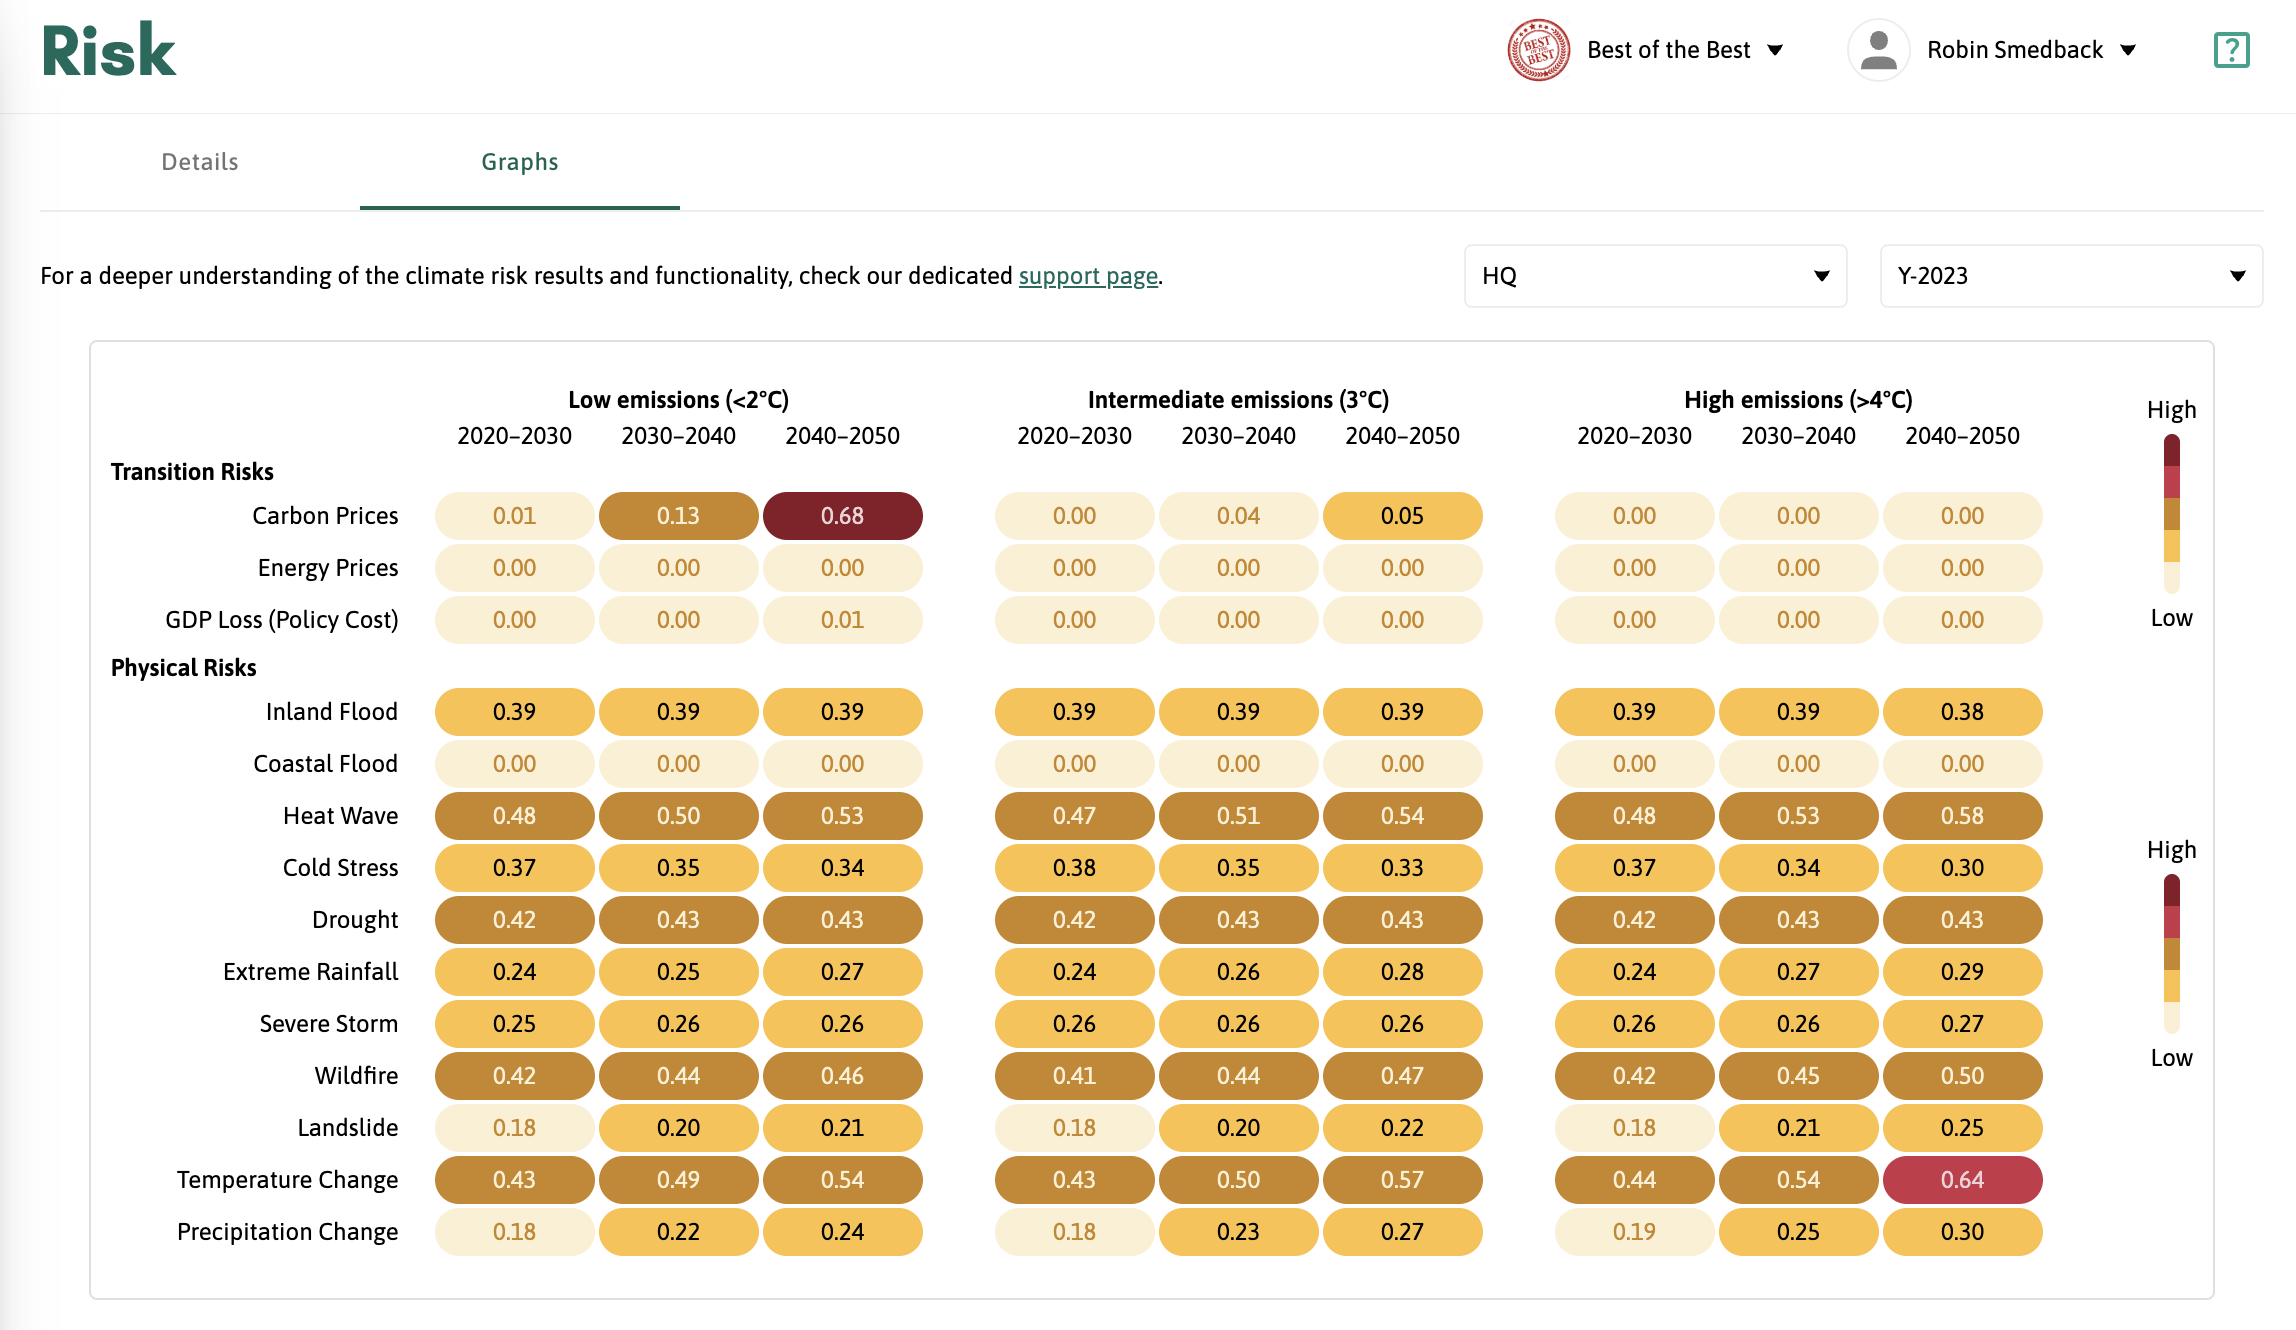
In the Graphs tab, you have the option to toggle between different Business Units and Reporting Periods. All numbers expressed in the graph are between 0 and 1, in the Transition Risks this equates to percentages (e.g., 0.68 = 68%) and in the Physical Risks, it is a relative risk scoring between 0 and 1. A detailed breakdown of all the risks can be found in the detailed explanation article mentioned at the top of the page.
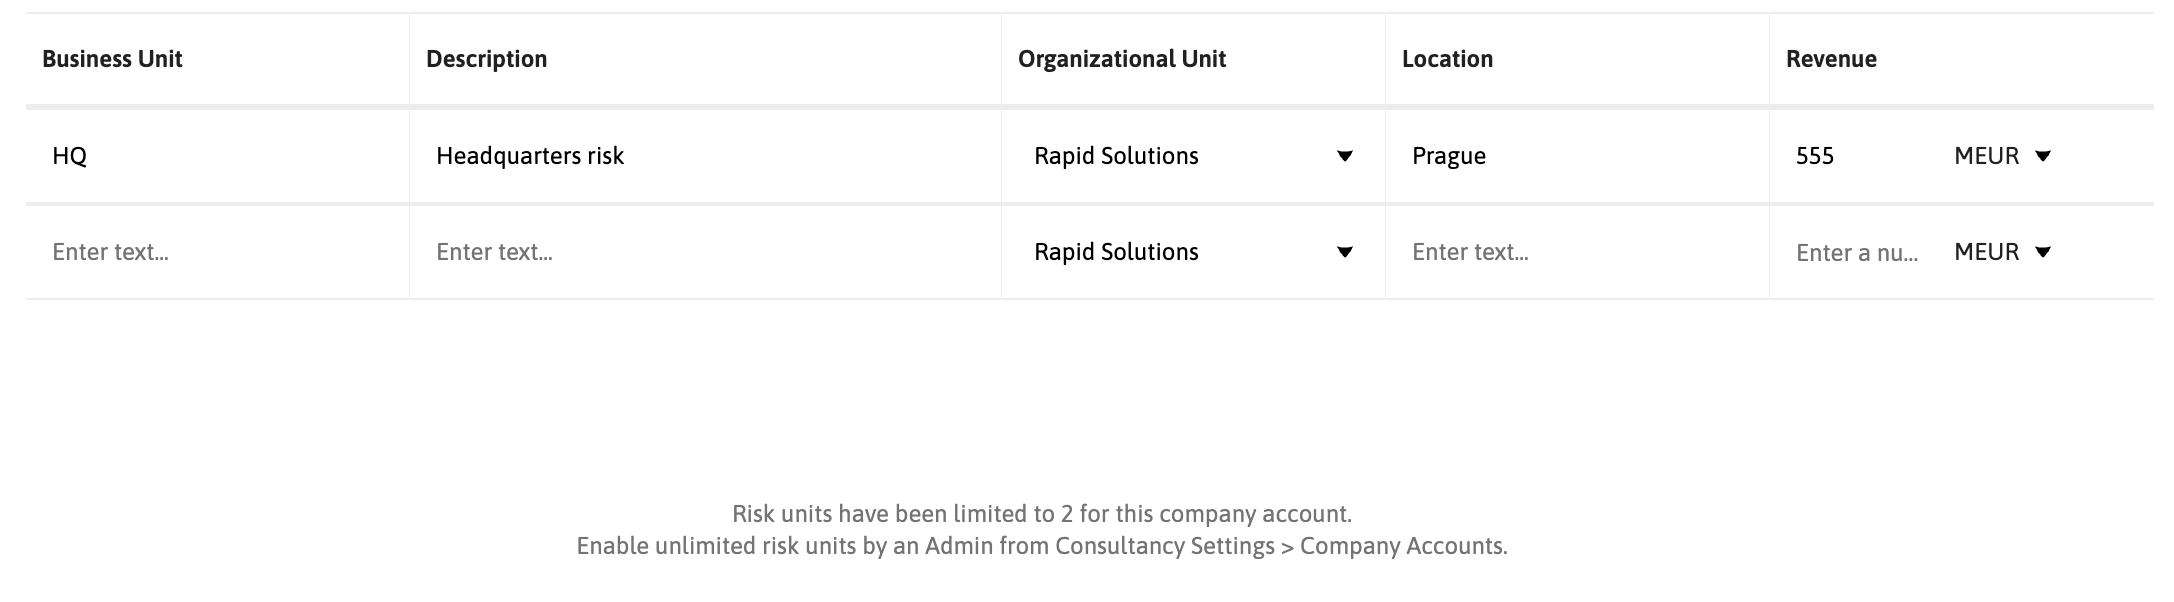
The Risk feature comes with two Business Units free of charge and if you need to add more, you can easily enable unlimited units in Consultancy Settings in the Company Account in question.
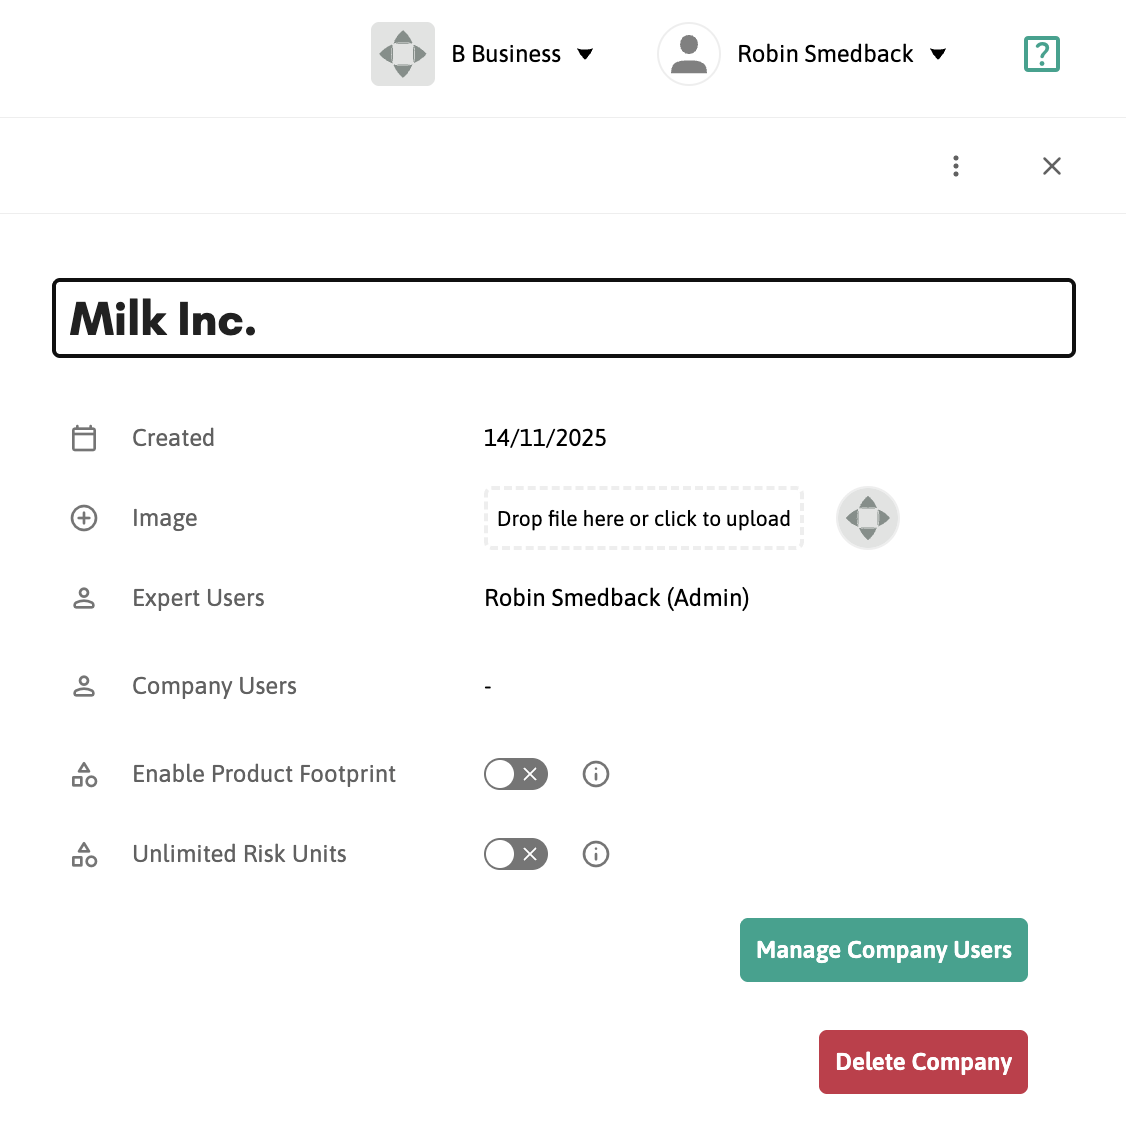
By toggling on "Unlimited Risk Units", you can create as many Business Units as needed. Note that this comes with an additional cost added to your invoice, which is explained in the confirmation dialog when toggling on the feature.